VictoryLine provides the technical orientation required to utilize professional analysis utilities effectively within global trading environments. We focus on teaching participants how to interpret raw market data, economic indicators, and technical charts to form an independent perspective on market behavior. Our role is strictly educational, ensuring you understand how to navigate the analytical features of a broker’s platform without providing specific trading recommendations or signals. By mastering these research tools, you can approach the financial markets with a structured methodology based on factual data and historical price action.


We provide guidance on tracking global economic events, central bank announcements, and employment data that generate market volatility. Understanding the timing and significance of these scheduled releases is vital for maintaining situational awareness while participating in global financial markets.

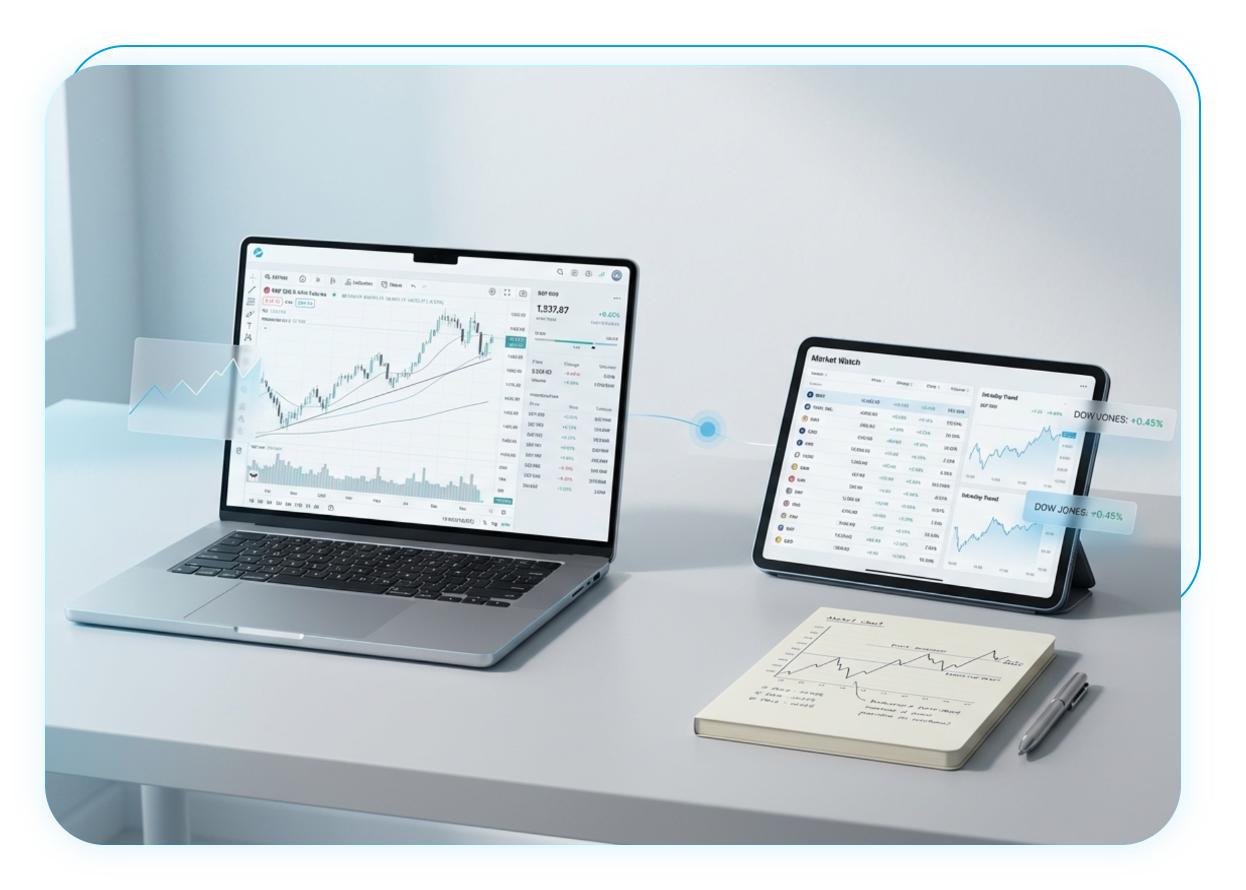
Learn how to apply and read various technical indicators such as moving averages, oscillators, and volume metrics to visualize market trends. We explain the mathematical logic behind these tools, helping you understand how they reflect past price activity to support your independent research process.

Our consultation covers how to utilize live news aggregators and market sentiment tools provided by regulated brokers. We help you understand how to filter publicly available information to gauge the general market mood and identify the fundamental drivers affecting different asset classes.
Begin by reviewing the economic calendar for upcoming high-impact events and monitoring historical price data through the broker’s charting interface.
Apply selected technical tools and indicators to visualize volatility zones, support levels, and potential trend directions based on factual market history.
Combine the gathered information with current news sentiment to form a comprehensive and independent view of the market environment.
Professional analysis is a skill that requires a deep understanding of the tools and data available in the financial ecosystem. At VictoryLine, we provide the mentorship needed to transform complex market data into clear, actionable insights through structured technical training. Whether you are learning to read advanced charts or navigating global economic calendars, our team ensures you have the analytical foundation to engage with brokers responsibly. Contact us today to arrange your analysis orientation session and start building your market research expertise.

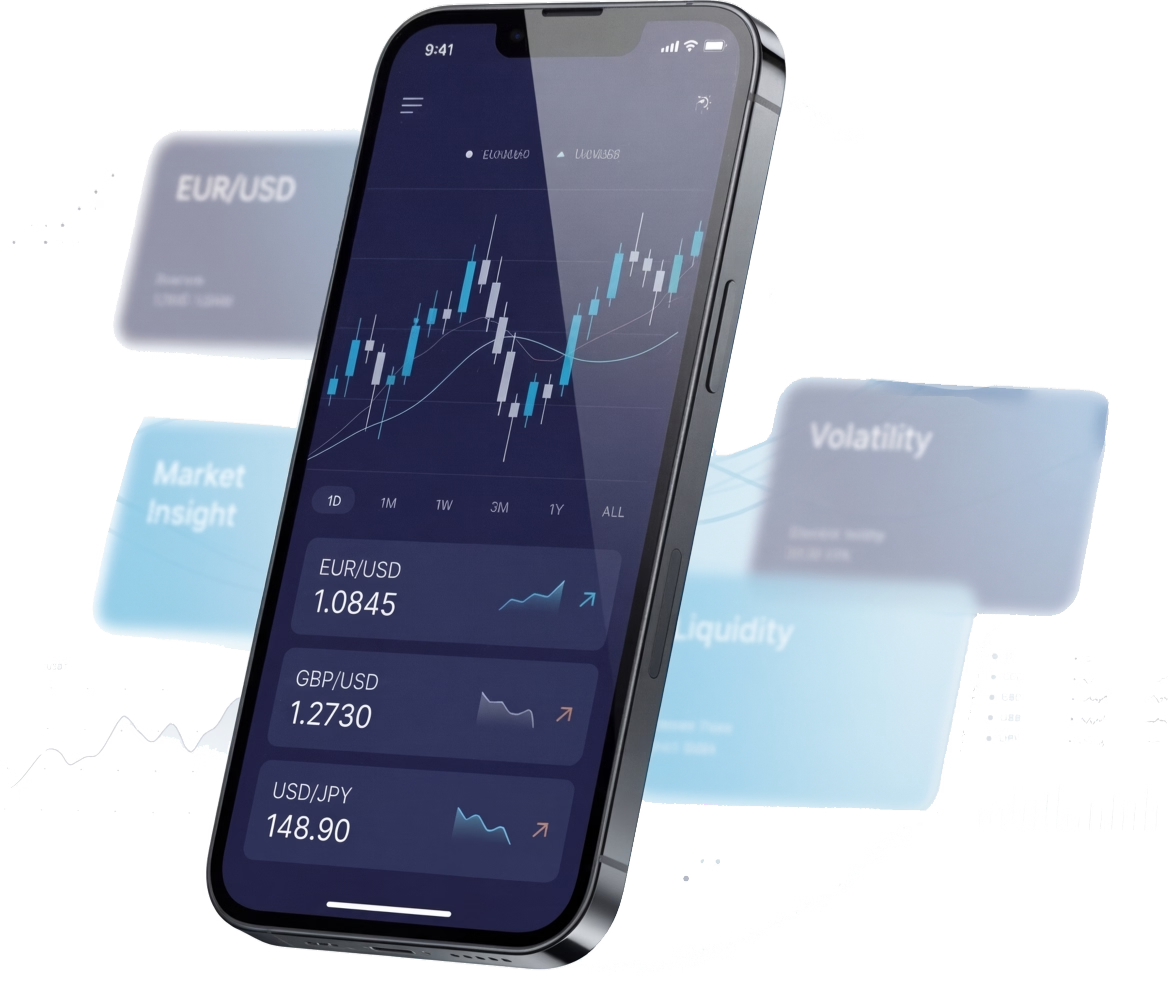
The analysis tools provided in our mentorship sessions are particularly powerful when applied to the high-liquidity environment of the foreign exchange market. VictoryLine demonstrates how technical indicators and economic calendars are utilized to interpret value-driven insights in Forex pairs. By cross-referencing your analytical training with our specific market insights, you can see how raw data is transformed into a professional market perspective. We encourage you to explore our dedicated Forex section to see these analysis tools in action, providing you with a practical example of how professional research influences market observation.
VictoryLine Introduction Financial Services L.L.C
VictoryLine Introduction Financial Services L.L.C acts exclusively as an SCA-Regulated Financial Introducer and Consultant.Regulated by Securities and Commodities Authority (SCA) | License : 20200000252