VictoryLine offers a structured technical overview of the evolving cryptocurrency sector, focusing on liquidity distribution and volatility profiles. We provide our users with the neutral perspective required to understand how digital assets interact with traditional financial systems.
Unlike traditional currencies, digital assets derive value from network utility, scarcity protocols, and adoption rates. VictoryLine describes the technical factors influencing valuation, such as hash rates and institutional inflows. Understanding these on-chain metrics is essential for distinguishing between speculative volatility and the underlying growth of a digital ecosystem.

We categorize assets into large and mid-cap tiers, explaining the different risk-reward profiles and liquidity depth associated with each.
Review Crypto TiersThis segment details how liquidity is distributed across global exchanges and the impact of "order book depth" on price stability.
Understand Exchange FlowLearn how crypto-specific volatility is measured compared to traditional equities and what this means for capital allocation strategies.
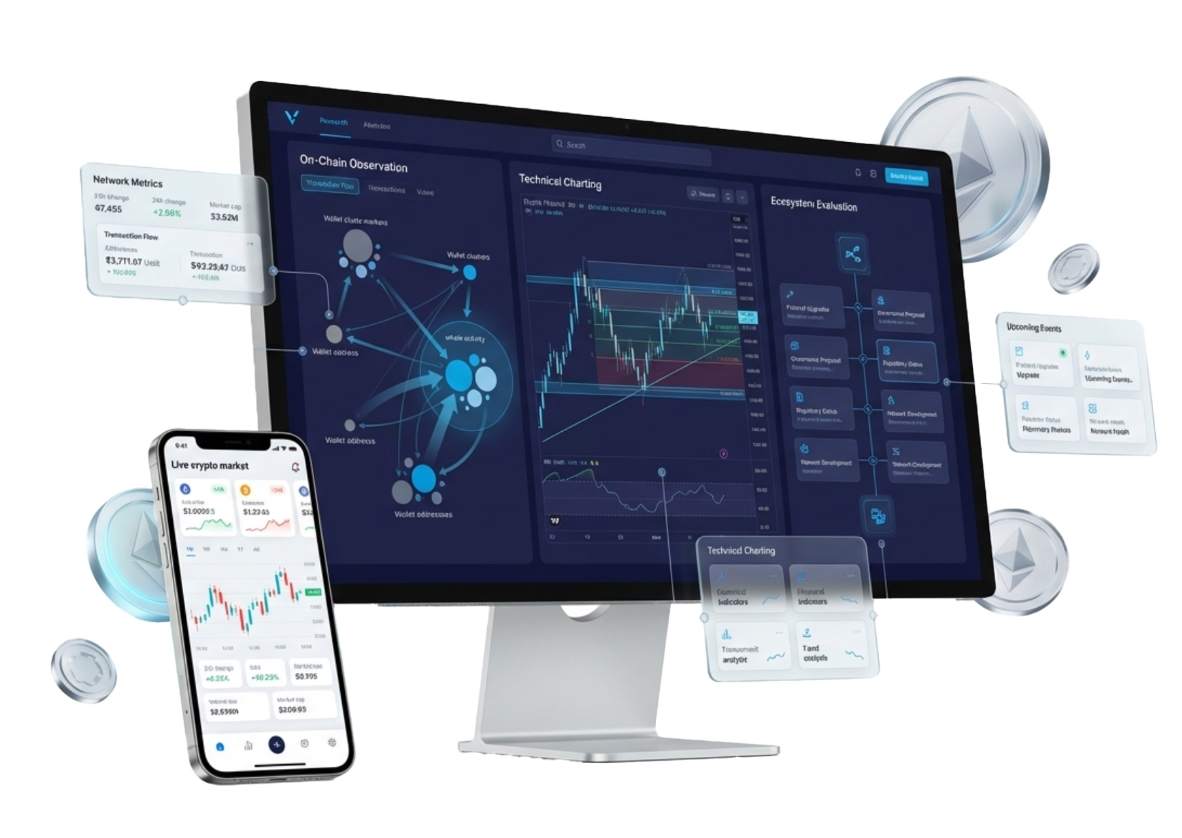
Examine Volatility IndexAnalyzing transaction volumes and "whale" movements directly from the blockchain to gauge large-scale interest.
Applying traditional candlestick analysis and Fibonacci levels to identify psychological price barriers in digital markets.
Assessing the regulatory landscape and technological upgrades (forks/merges) that could impact long-term asset viability.
As digital assets mature, their correlation with traditional "risk-on" markets—particularly high-growth tech stocks—has become a critical area of professional study.
VictoryLine bridges the gap between digital asset intelligence and practical participation through three specialized pillars:

Connect with SCA-licensed or globally regulated brokers that offer transparent digital asset exposure.
Find Crypto Brokers
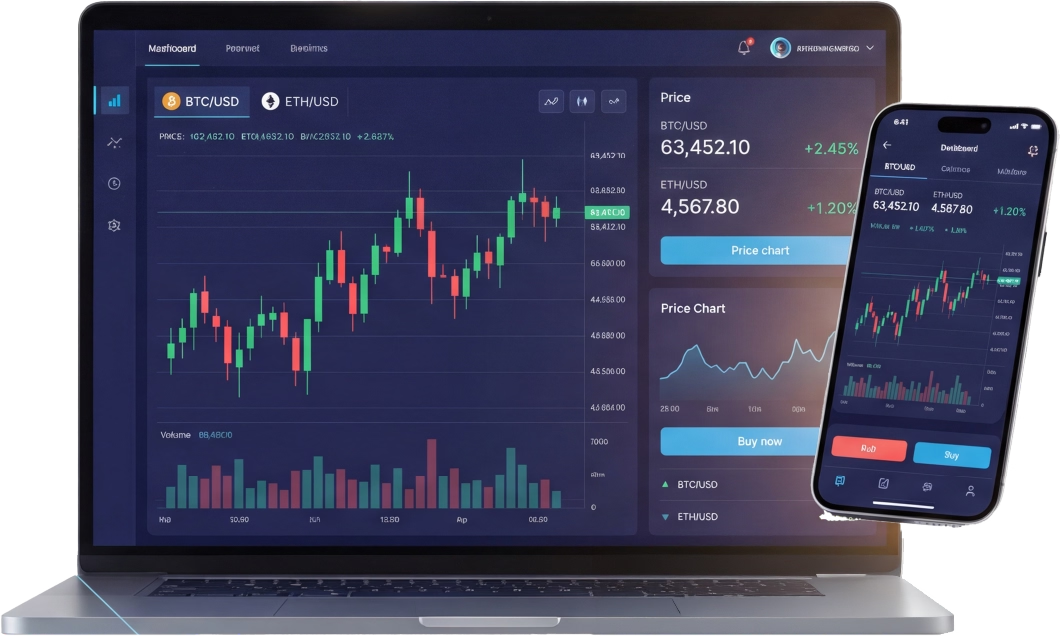
Ensure your platform is configured to handle the 24/7 data feeds and volatility inherent in digital asset markets.
Setup Crypto Charts
Apply the dynamics learned here to our daily technical research and expert digital asset commentary.
View Daily AnalysisUnderstanding how to monitor network health beyond the price chart.
Recognizing the impact of halving events and liquidity cycles on long-term trends.
Implementation of strict capital protection frameworks to manage high volatility.
Verification of the legal status of assets and platforms within your jurisdiction.
VictoryLine Introduction Financial Services L.L.C
VictoryLine Introduction Financial Services L.L.C acts exclusively as an SCA-Regulated Financial Introducer and Consultant.Regulated by Securities and Commodities Authority (SCA) | License : 20200000252