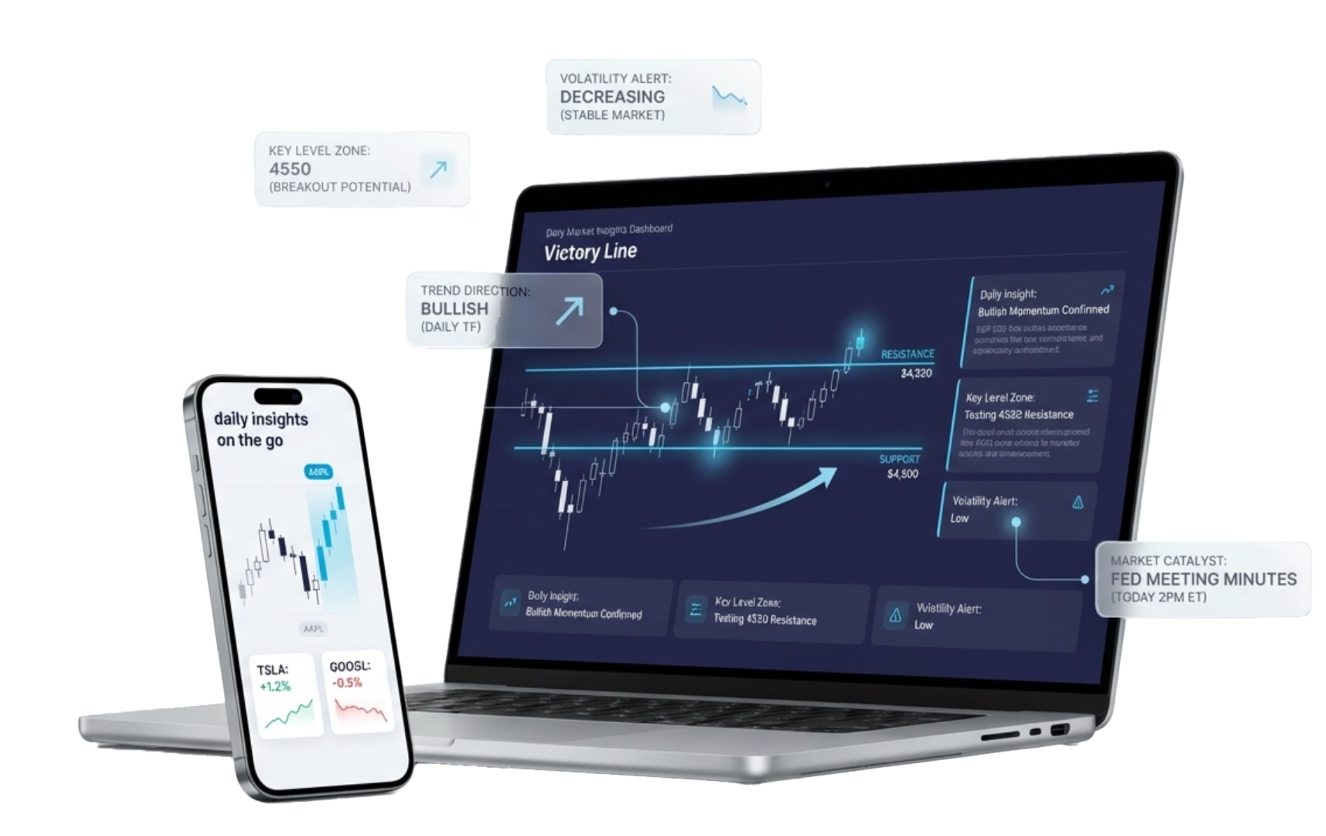
VictoryLine provides users with a daily synthesis of global market movements, filtering out noise to focus on high-probability technical levels. We bridge the gap between raw data and actionable intelligence, ensuring our members maintain professional situational awareness every trading day.
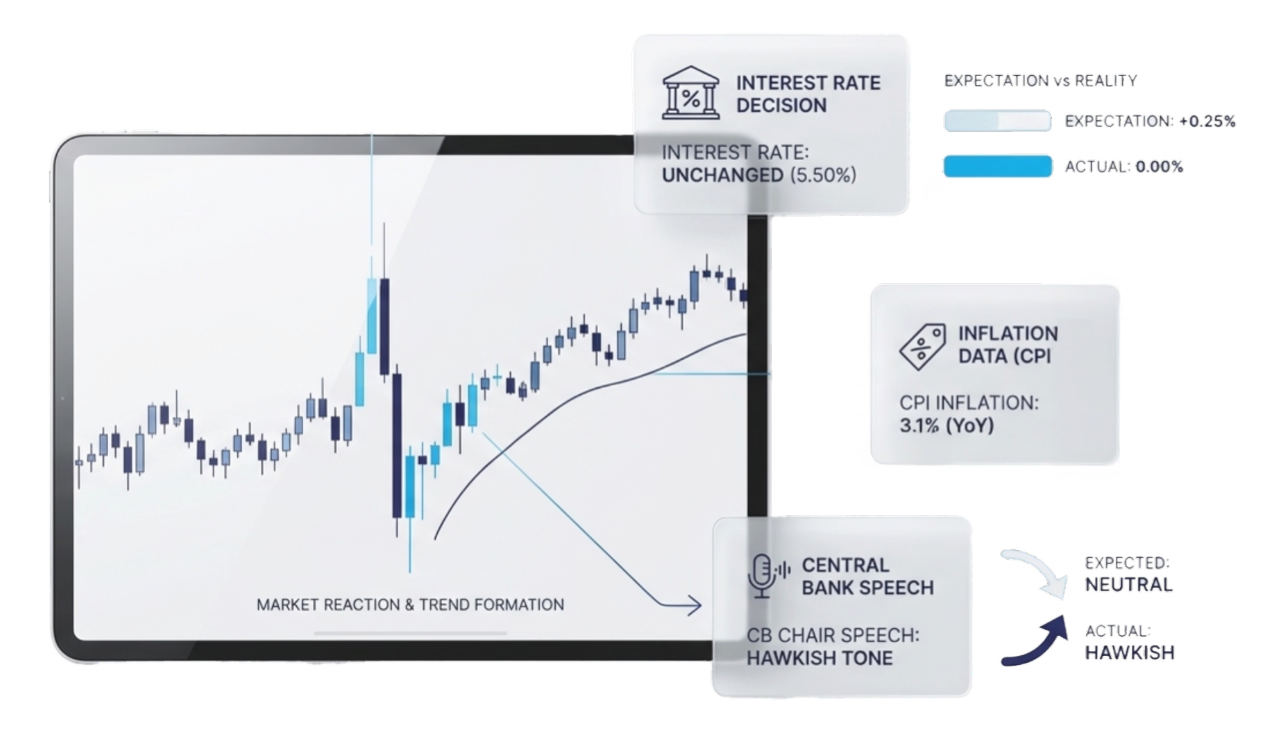
Every trading session is shaped by a unique combination of geopolitical shifts and economic data. This segment contrasts current market expectations with actual outcomes, explaining the "why" behind the latest price action. VictoryLine provides the descriptive context for events like central bank speeches or inflation reports, helping you understand their immediate impact on global sentiment and daily trend cycles.
We identify key price floors and ceilings where institutional activity is concentrated, providing a roadmap for the current session's volatility.
Review Daily LevelsThis segment details RSI and MACD data to determine if specific assets are reaching overextended "Overbought" or "Oversold" conditions.
Check Momentum DataUnderstanding the volume behind a price move helps our users distinguish between genuine structural breakouts and temporary market "fakeouts".
Analyze Volume TrendsAnalyzing how the Asian and European sessions have established the technical bias for the upcoming New York open.
Identifying specific "high-impact" windows in the daily calendar where volatility is expected to peak.
Cross-referencing moves in the US Dollar Index (DXY) with Gold and Major FX pairs to ensure a consistent technical outlook.
Our daily analysis tracks how real-time moves in leading indicators like Bond Yields or Oil prices create ripple effects across the currency and equity markets.
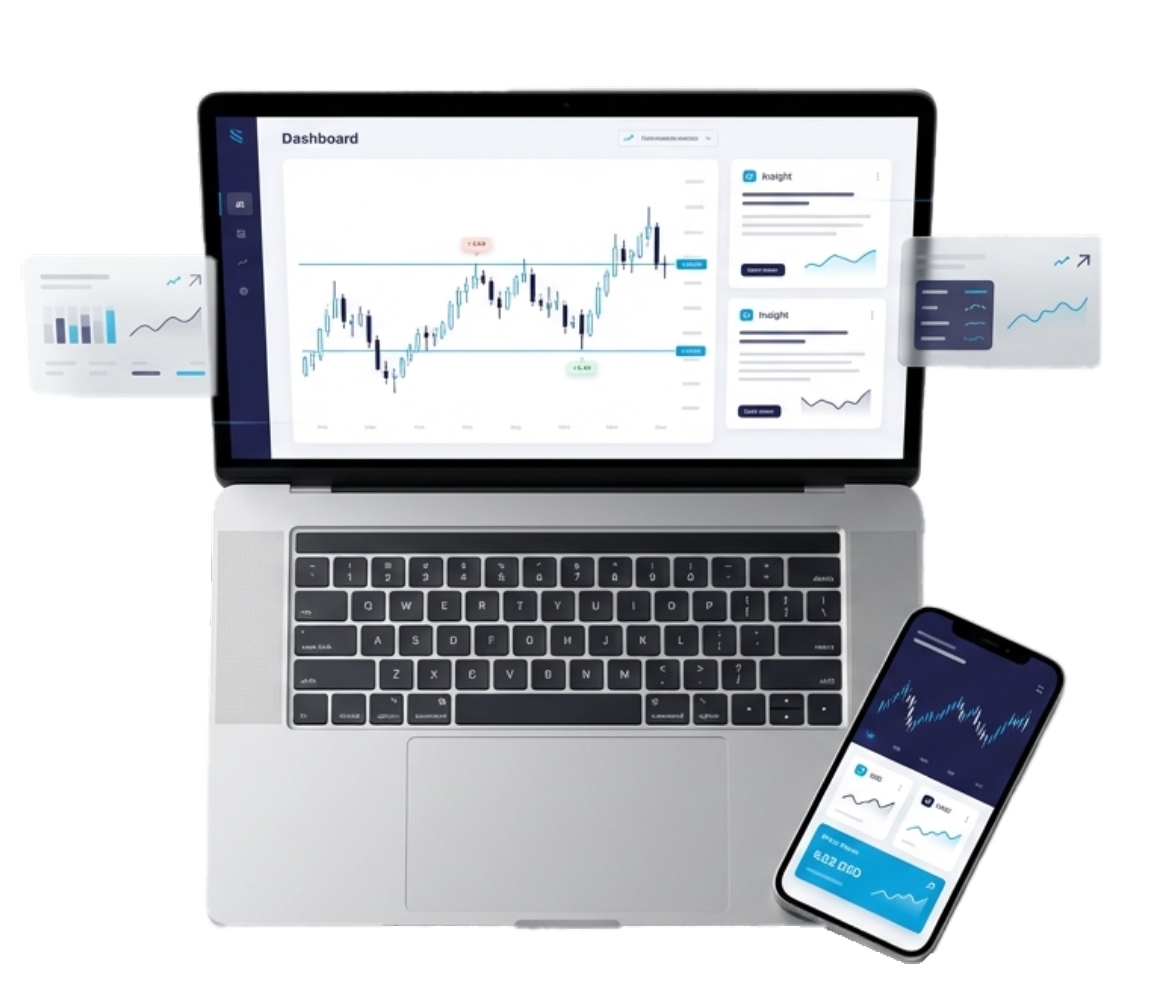
VictoryLine ensures that daily market intelligence is seamlessly integrated with your operational tools through three key support pillars:

Use our daily levels to update your MT4/MT5 charts with accurate support, resistance, and pivot point data.
Sync Your Platform
Align your daily technical bias with the deep liquidity and tight spreads provided by our vetted broker partners.
Choose Your Broker
Move from daily summaries to deep-dive sessions using our professional research and analysis toolkit.
Access Analysis ToolsHave you identified the prevailing trend from the London/Asian market opens?
Are you aware of the exact timing for today’s scheduled economic releases?
Have your technical levels been adjusted to account for the previous day’s High and Low?
Does your current outlook align with broader moves in the Dollar and Treasury markets?
VictoryLine Introduction Financial Services L.L.C
VictoryLine Introduction Financial Services L.L.C acts exclusively as an SCA-Regulated Financial Introducer and Consultant.Regulated by Securities and Commodities Authority (SCA) | License : 20200000252